
Automatic observability of VKS Clusters in VCF Operations
Part of the VKS addon catalog are Prometheus and Telegraf. In the past, to enable the metrics collection (and shipping to VCF Operations) those had to be installed manually. An excellent guide on how to do this can be found here: Monitoring VKS Clusters in VCF Operations.
With the introduction of VCF 9.1 the platform is using the new addon management framework to automate the installation of the required packages similar to how Cluster Autoscaler installation is handled. For all new VKS clusters, this is enabled by default - no extra steps necessary. Here is an example of the annotations that get added by the system:
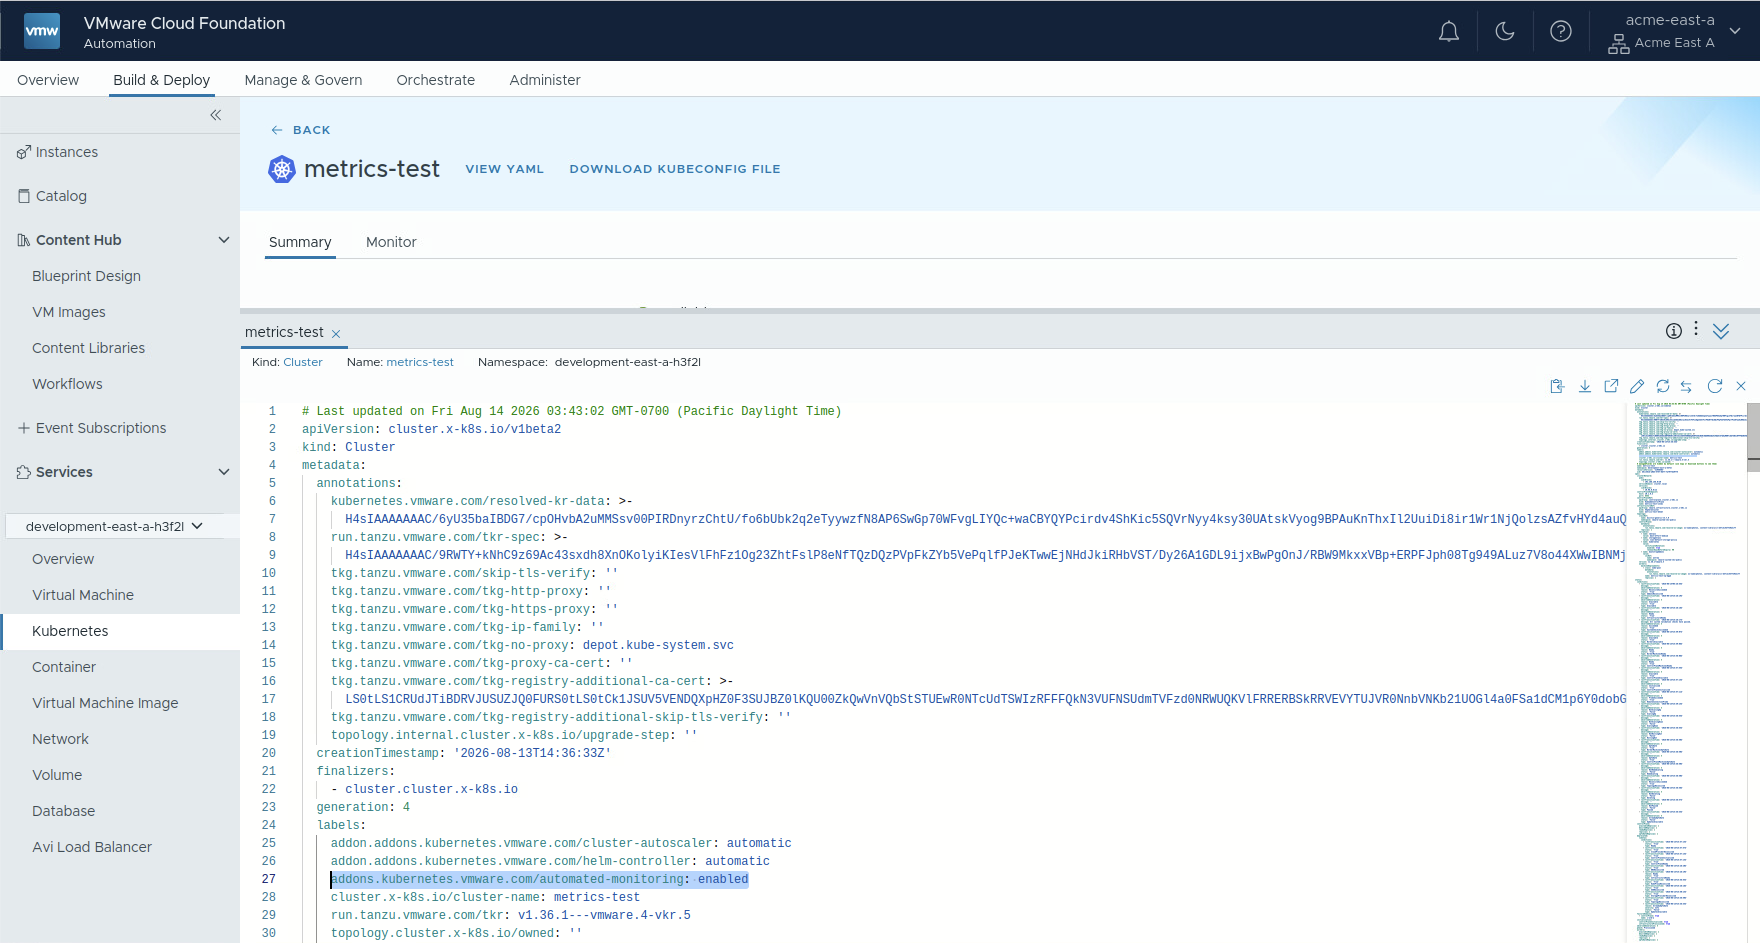
If for some reason you don't want that, you can set the annotation to disabled. The official documentation provides more detail on the behaviour: Monitoring VKS Clusters Using VCF Operations.
Motivation
By default data is aggregated at the node/cluster level and namespace, deployment and replicaset level as well, as can be seen in this example:
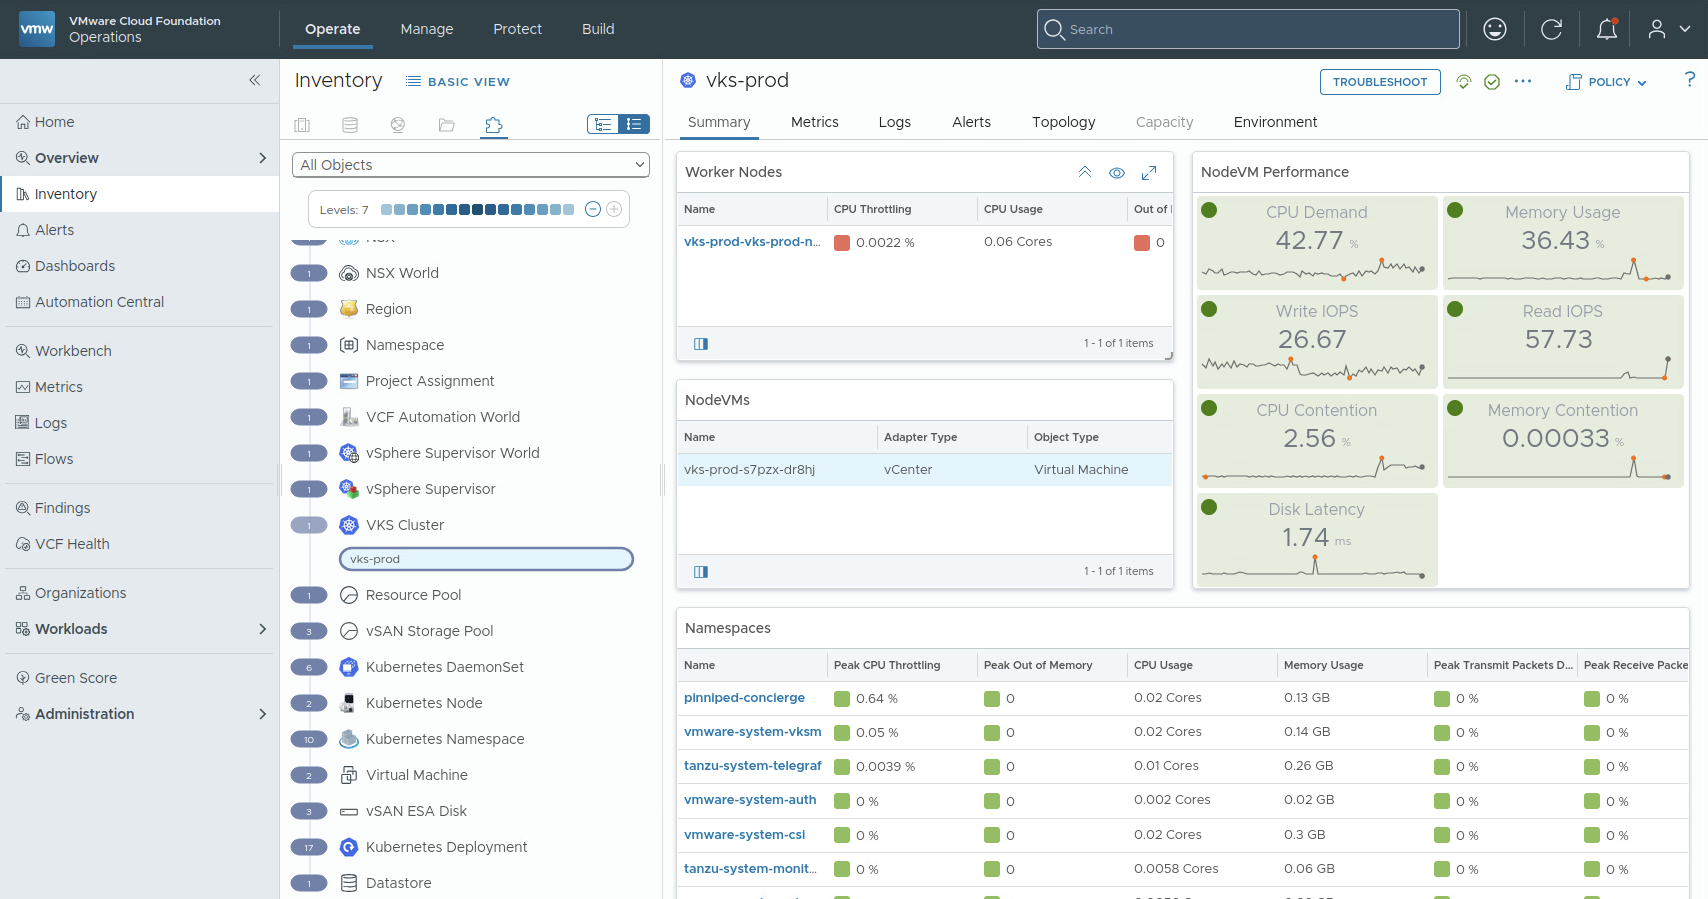
Actual pod and container metrics are not enabled by default. This makes sense - pod/container data is often short-lived due to their ephemeral nature. But sometimes this level of detail is necessary. VCF Operations 9.1 lets you toggle Pod Monitoring for a VKS (vSphere Kubernetes Service) cluster from the UI, once that cluster has been added to the system.
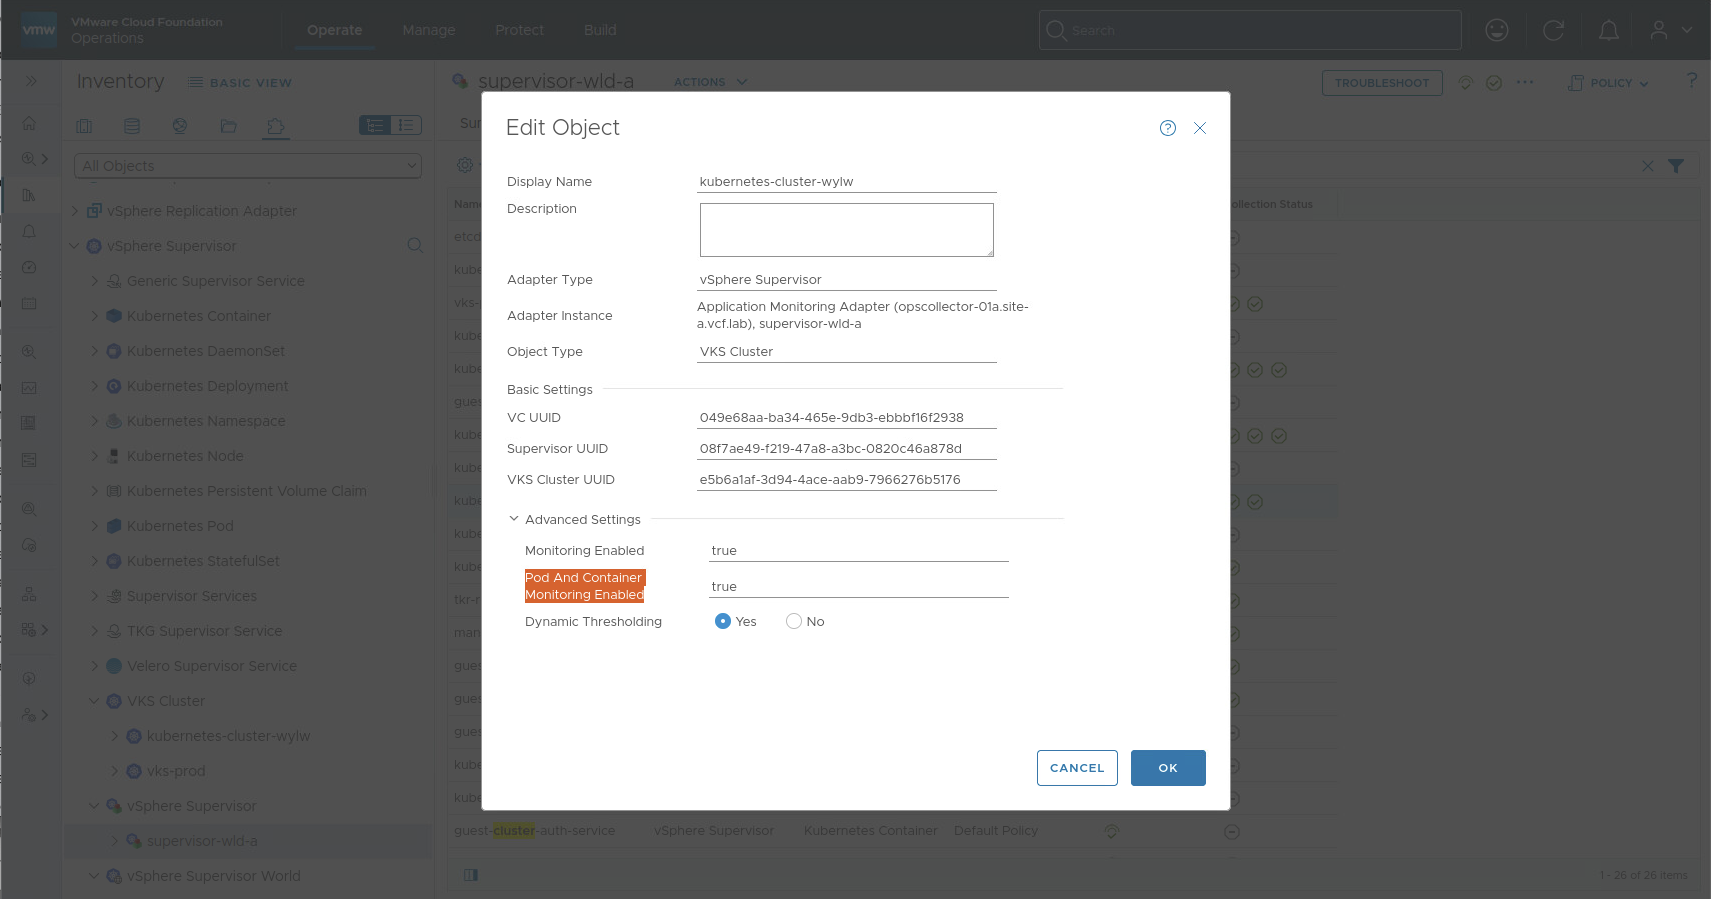
Since this is a manual UI task, I wanted to find out the API way to do this, in preparation for further automation down the line - like toggle this setting right from within VCF Automation.
VCF Operations exposes a REST API endpoint called suite-api - this is the same, officially supported integration API documented at developer.broadcom.com/xapis/vcf-operations-api, and it's also self-hosted on every appliance at:
https://<vcf-ops-host>/suite-api/docs/rest/index.html
https://<vcf-ops-host>/suite-api/doc/swagger-ui.html
The built-in Swagger UI makes it especially easy to try out the API and start experimenting. What is not spelled out anywhere in the docs is which field controls pod monitoring for a VKS cluster. That part had to be reverse-engineered from the live resource model.
Step 1 - Authenticate
Every call needs a bearer token from /api/auth/token/acquire:
curl -sk -X POST https://<vcf-ops-host>/suite-api/api/auth/token/acquire \
  -H "Content-Type: application/json" -H "Accept: application/json" \
  -d '{"username":"<username>","password":"<password>"}'
Response:
{"token":"978f65d0-...::f3b9b83c-...", "validity":..., "expiresAt":"...", "roles":[]}Send it back as a header on every subsequent request:
Authorization: OpsToken <token>
Step 2 - Find the adapter kind that owns Kubernetes objects
VCF Operations models everything as adapter kinds -> resource kinds -> resources. To find where VKS clusters live, list adapter kinds and look for one whose resource kinds mention Kubernetes objects:
curl -sk https://<host>/suite-api/api/adapterkinds \
  -H "Authorization: OpsToken $TOKEN" -H "Accept: application/json"
The adapter kind SupervisorAdapter ("vSphere Supervisor") turned up with resource kinds including GuestCluster, SupervisorCluster, KubernetesPod, KubernetesNamespace, etc. GuestCluster is what the UI labels VKS Cluster - confirmed by describing it:
curl -sk https://<host>/suite-api/api/adapterkinds/SupervisorAdapter/resourcekinds/GuestCluster \
  -H "Authorization: OpsToken $TOKEN" -H "Accept: application/json"
POD_CONTAINER_MONITORING immediately stands out - that's the field the "Enable Pod Monitoring" toggle in the UI is writing to.
{
  "key": "GuestCluster",
  "name": "VKS Cluster",
  "adapterKind": "SupervisorAdapter",
  "resourceIdentifierTypes": [
    {"name": "GUEST_CLUSTER_UUID", "dataType": "STRING", "isPartOfUniqueness": true},
    {"name": "MONITORING_ENABLED", "dataType": "STRING", "isPartOfUniqueness": false},
    {"name": "POD_CONTAINER_MONITORING", "dataType": "STRING", "isPartOfUniqueness": false},
    {"name": "SUPERVISOR_UUID", "dataType": "STRING", "isPartOfUniqueness": true},
    {"name": "VC_UUID", "dataType": "STRING", "isPartOfUniqueness": true}
  ]
}
Listing actual GuestCluster resources across several VKS clusters confirmed it: clusters with pod monitoring enabled in the UI had POD_CONTAINER_MONITORING = "true", and the one cluster with it turned off had "false".
curl -sk "https://<host>/suite-api/api/resources?resourceKind=GuestCluster&adapterKind=SupervisorAdapter&name=metrics-test" \
  -H "Authorization: OpsToken $TOKEN" -H "Accept: application/json"
Here is a response for one cluster (with some data trimmed out that is noise for our purposes):
{
  "resourceList": [
    {
      "resourceKey": {
        "name": "metrics-test",
        "adapterKindKey": "SupervisorAdapter",
        "resourceKindKey": "GuestCluster",
        "resourceIdentifiers": [
          {
            "identifierType": {"name": "GUEST_CLUSTER_UUID", "dataType": "STRING", "isPartOfUniqueness": true},
            "value": "b6cc361b-a0d3-4757-8d77-7a7977be9f75"
          },
          {
            "identifierType": {"name": "MONITORING_ENABLED", "dataType": "STRING", "isPartOfUniqueness": false},
            "value": "true"
          },
          {
            "identifierType": {"name": "POD_CONTAINER_MONITORING", "dataType": "STRING", "isPartOfUniqueness": false},
            "value": "false"
          },
          {
            "identifierType": {"name": "SUPERVISOR_UUID", "dataType": "STRING", "isPartOfUniqueness": true},
            "value": "6e227f64-7211-48c5-b201-1e25ce19678e"
          },
          {
            "identifierType": {"name": "VC_UUID", "dataType": "STRING", "isPartOfUniqueness": true},
            "value": "f7839017-1f73-4122-b27c-3ed8450729e6"
          }
        ]
      },
      "identifier": "38ff122b-8776-4d70-8b3c-fac80c9825c3",
      "links": [
        {"href": "/suite-api/api/resources/38ff122b-8776-4d70-8b3c-fac80c9825c3", "rel": "SELF", "name": "linkToSelf"}
      ]
    }
  ]
}
Worth noting is the identifier (top-level, 38ff122b-8776-4d70-8b3c-fac80c9825c3) - the ID needed for the next step.
Step 3 - Flip it
The write path is PUT /suite-api/api/resources. The body is the full resource, with the identifier's value changed, and the resource's own ID passed in a field literally called identifier:
# file: update_resource.json
{
  "identifier": "<resource-id>",
  "resourceKey": {
    "name": "<cluster-name>",
    "adapterKindKey": "SupervisorAdapter",
    "resourceKindKey": "GuestCluster",
    "resourceIdentifiers": [
      {"identifierType": {"name": "GUEST_CLUSTER_UUID", "dataType": "STRING", "isPartOfUniqueness": true}, "value": "..."},
      {"identifierType": {"name": "MONITORING_ENABLED", "dataType": "STRING", "isPartOfUniqueness": false}, "value": "true"},
      {"identifierType": {"name": "POD_CONTAINER_MONITORING", "dataType": "STRING", "isPartOfUniqueness": false}, "value": "true"},
      {"identifierType": {"name": "SUPERVISOR_UUID", "dataType": "STRING", "isPartOfUniqueness": true}, "value": "..."},
      {"identifierType": {"name": "VC_UUID", "dataType": "STRING", "isPartOfUniqueness": true}, "value": "..."}
    ]
  }
}
curl -sk -X PUT "https://<host>/suite-api/api/resources" \
-H "Authorization: OpsToken $TOKEN" -H "Content-Type: application/json" -H "Accept: application/json" \
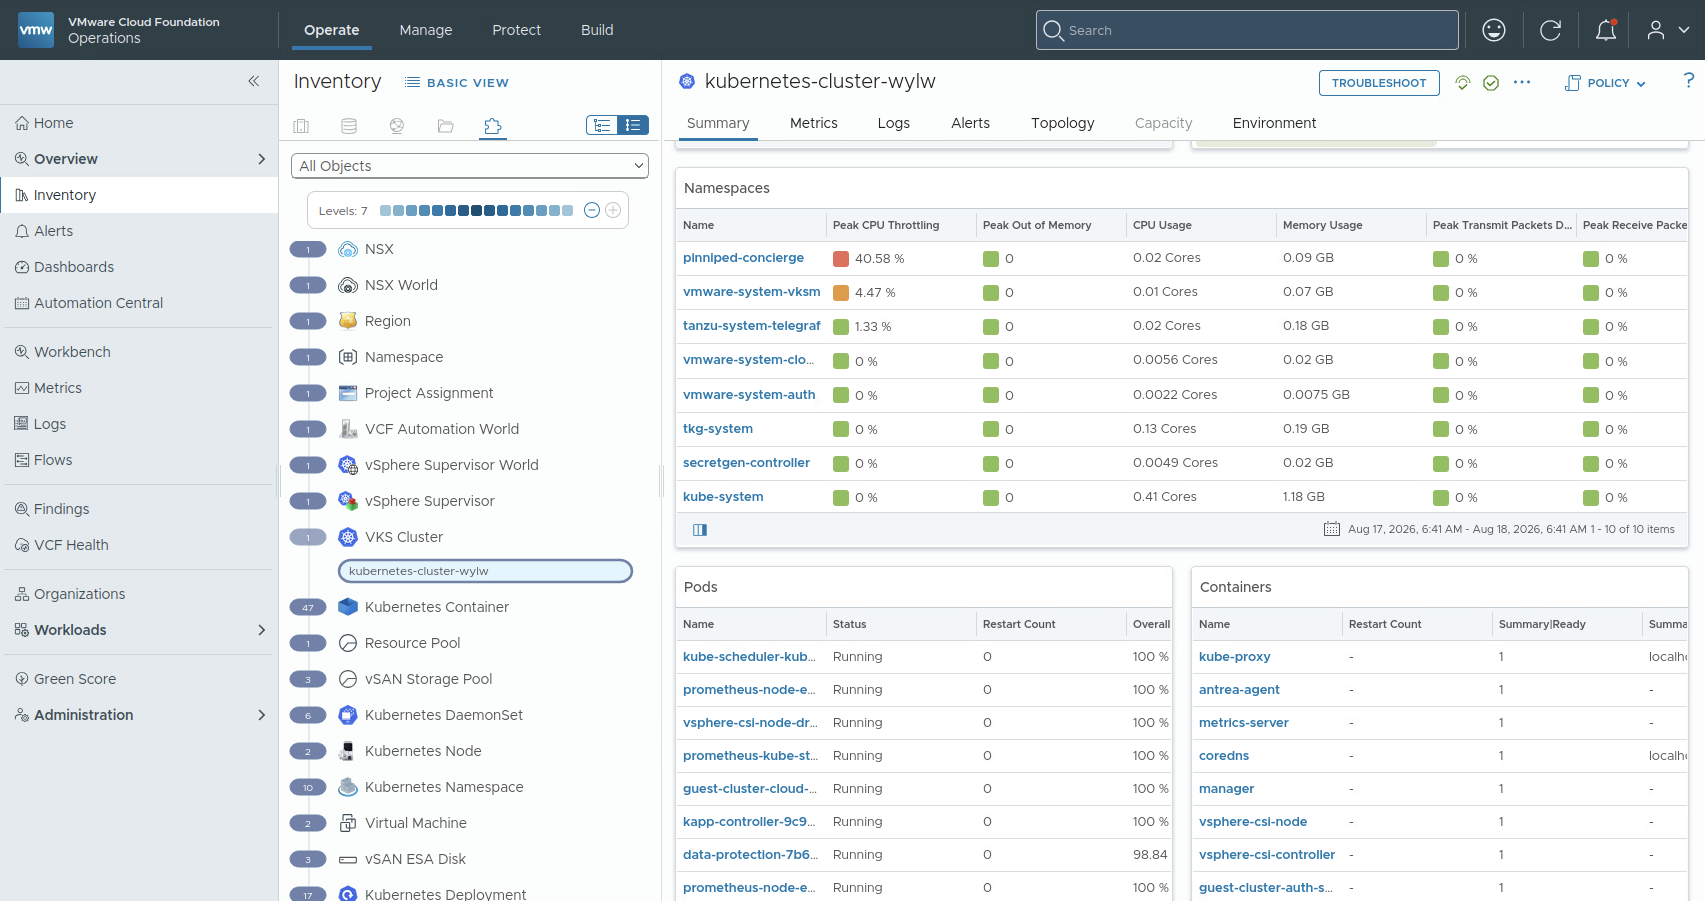
-d @update_resource.jsonA follow-up GET on the resource or check in the UI confirmed the change has been applied successfully, with pod and container details now showing up in VCF Operations:
Putting it into a Python script
Broadcom put together an official Python SDK for VCF: vcf-sdk, a meta-package that pulls in per-product client libraries - vmware-vcenter, vcf-nsx, vcf-operations, etc. The one we need is vcf-operations:
Since I am not much of a programmer, I utilized the SDK and AI to help me out with putting this together. The code can be found here: Python client
Install and usage:
python3 -m venv .venv && source .venv/bin/activate
pip install vcf-operations==9.1.0.0

# list clusters and current state
python3 set_pod_monitoring.py --host ops-a.site-a.vcf.lab --username admin --list

# enable on a named cluster
python3 set_pod_monitoring.py --host ops-a.site-a.vcf.lab --username admin --cluster bookstore-app --enable

# no --cluster given -> interactive picker
python3 set_pod_monitoring.py --host ops-a.site-a.vcf.lab --username admin --enable
The password is prompted for interactively when --password is omitted. For unattended runs, set VCF_OPS_PASSWORD instead of passing it on the command line.
I ran this end-to-end (list -> enable -> verify -> disable) against a live VCF Operations 9.1 appliance:
$ python3 set_pod_monitoring.py --host ops-a.site-a.vcf.lab --username admin --list
NAME                     POD MONITORING
metrics-test             disabled
kubernetes-cluster-93hv  disabled
$ python3 set_pod_monitoring.py --host ops-a.site-a.vcf.lab --username admin --cluster metrics-test --enable
metrics-test: pod monitoring enabled
$ python3 set_pod_monitoring.py --host ops-a.site-a.vcf.lab --username admin --list
NAME                     POD MONITORING
metrics-test             enabled
kubernetes-cluster-93hv  disabled
$ python3 set_pod_monitoring.py --host ops-a.site-a.vcf.lab --username admin --cluster metrics-test --cluster kubernetes-cluster-93hv --disable
metrics-test: pod monitoring disabled
kubernetes-cluster-93hv: already disabled, skipping
Wrapping up
Pod and container metrics carry a cost - more data points, more storage, more noise - which is why the VCF Operations leaves them off by default. Being able to flip that on and off through the API, rather than only by clicking through the UI, makes it practical to enable the extra detail exactly when it's needed - chasing down a noisy workload or an OOM-killed pod - and turn it back off once the investigation is done, instead of leaving it running indefinitely out of convenience.
Next up: I want to do this in VCF Automation, so pod monitoring can be toggled automatically as part of a cluster's day-2 workflow or deployment.